S4 HANA Reporting
Fiori reporting challenges
- Fiori standard apps are not user friendly
- many apps can only show value and quantity, but no price measure
like sales price
- no % month over month measures (generally)
- only a few measures in one app
- two kinds of fiori for the same purpose (standard and accessible)
- basic charts and visuals
- clicking the scroll bar works only for a few rows instead of
expected page
wise scrolling
- the majority of users will end up "export to excel"
- some apps can only export 50 columns
- if the data is processed in a web browser, it is usually slow
- exporting "big" data from a browser often needs many confirmations
to continue
- SAC is an expensive tool
So, the following solution is 100% free with Power BI
Use cases: reports based on actual financial postings: balance
sheet, P&L, AP, AR, sales, purchasing, production, cost center,
inventories …
Step 1
SAP Transaction
![]()
This SAP transaction offers a download of the actual postings.
You can select by posting date and create monthly files.
File size obviously depends on many variables, but the PBI vertipaq
compression can handle this.
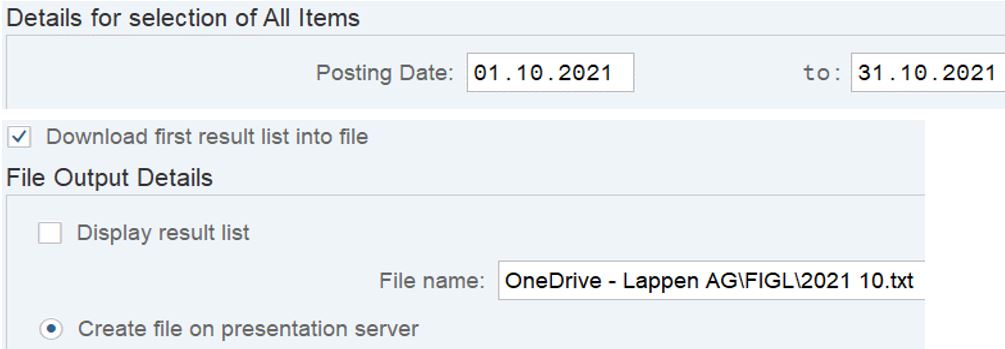
The output file can contain about 400+ columns and will be saved as
text for fast import to Power BI.
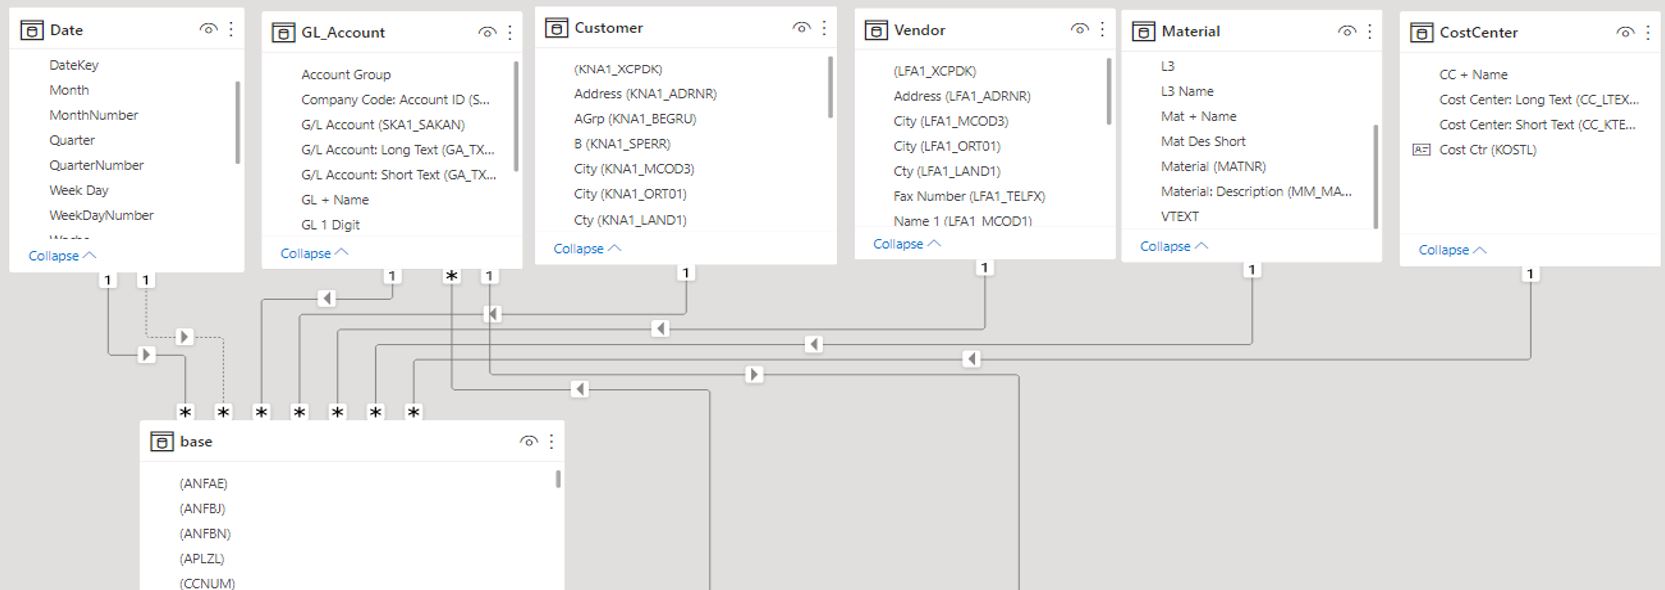
This flat file includes many columns that are actually dimensions.
They will be transformed into dim tables via Power Query.
Example: a manufacturing company with 500 FTE and 100 Mio revenue
generates around 10 Mio data rows p.a.
This will result in a 70 MB pbix file ->
No need for a DataWarehouse, though any IT department will judge
this as an offense...
Step 2
Import the data into the PBI datamodel
There are five dimension tables created out of the flat file in this
model:
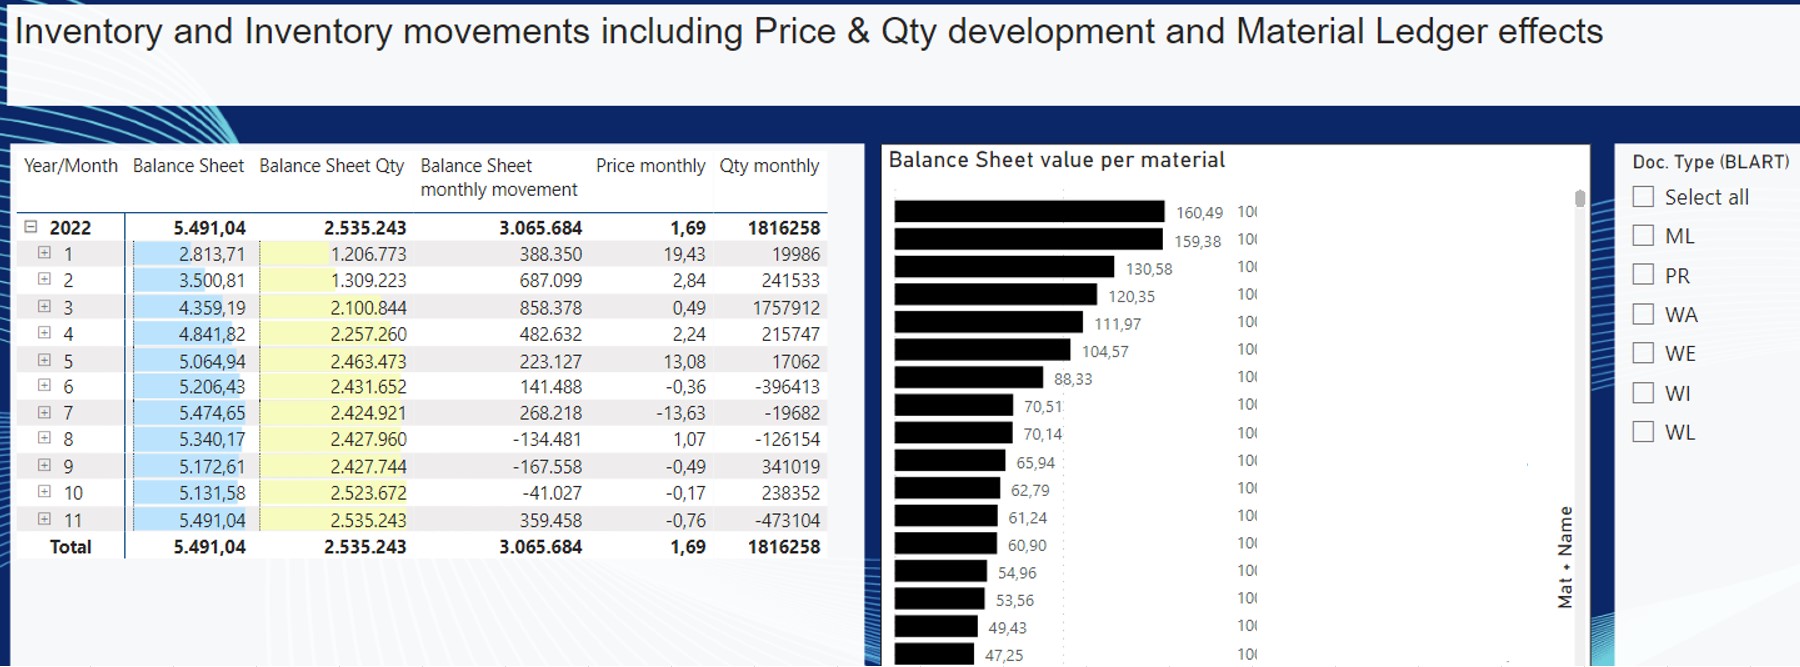
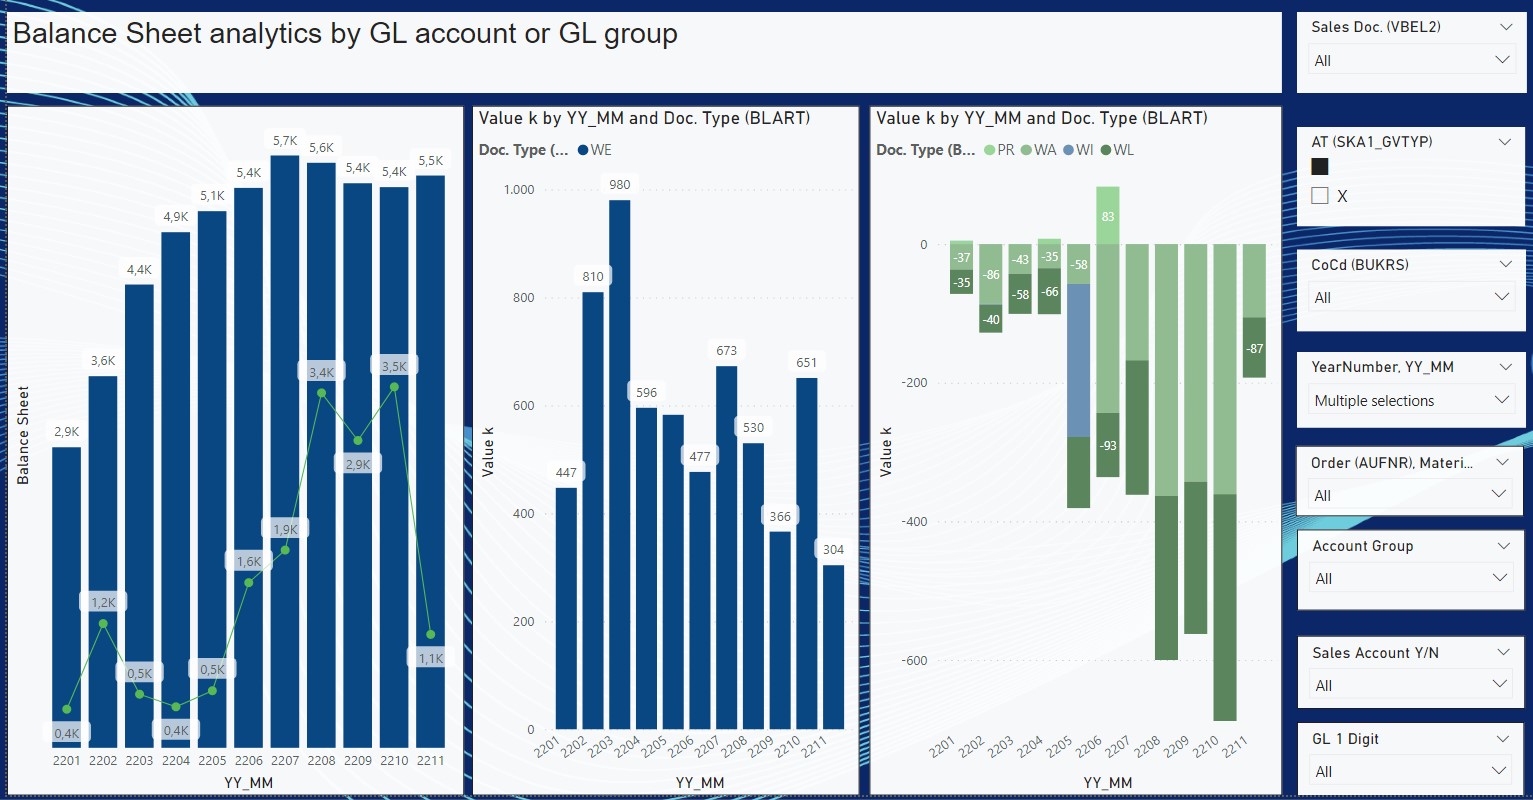
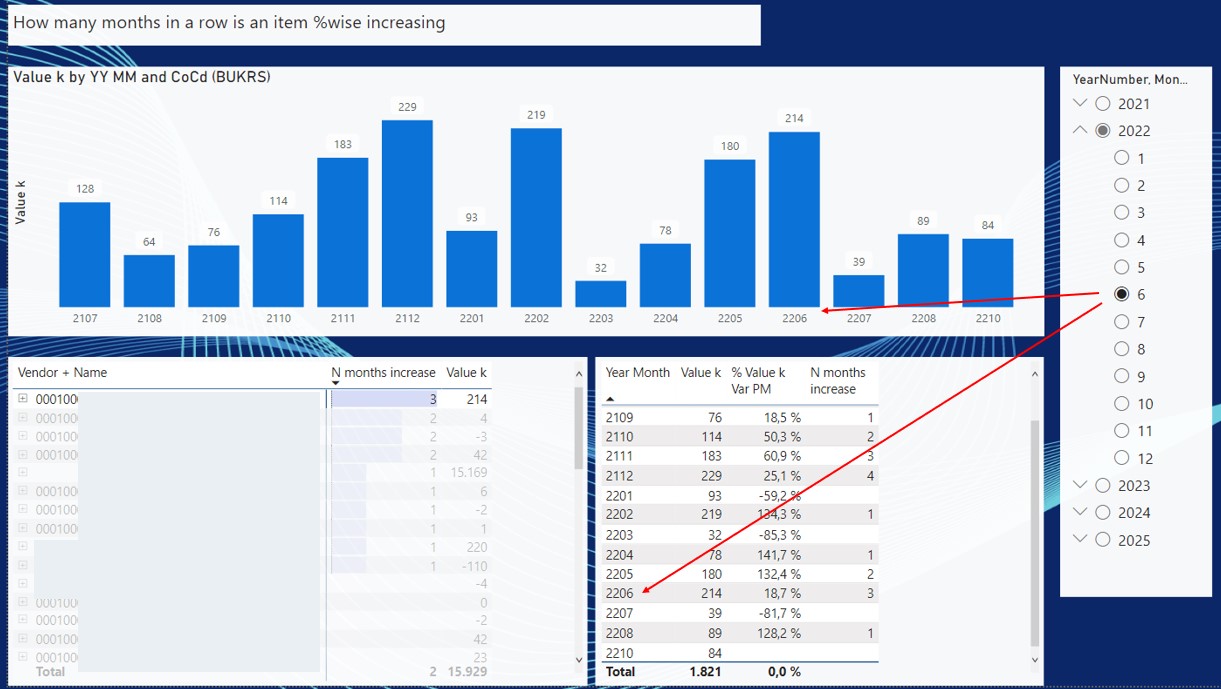
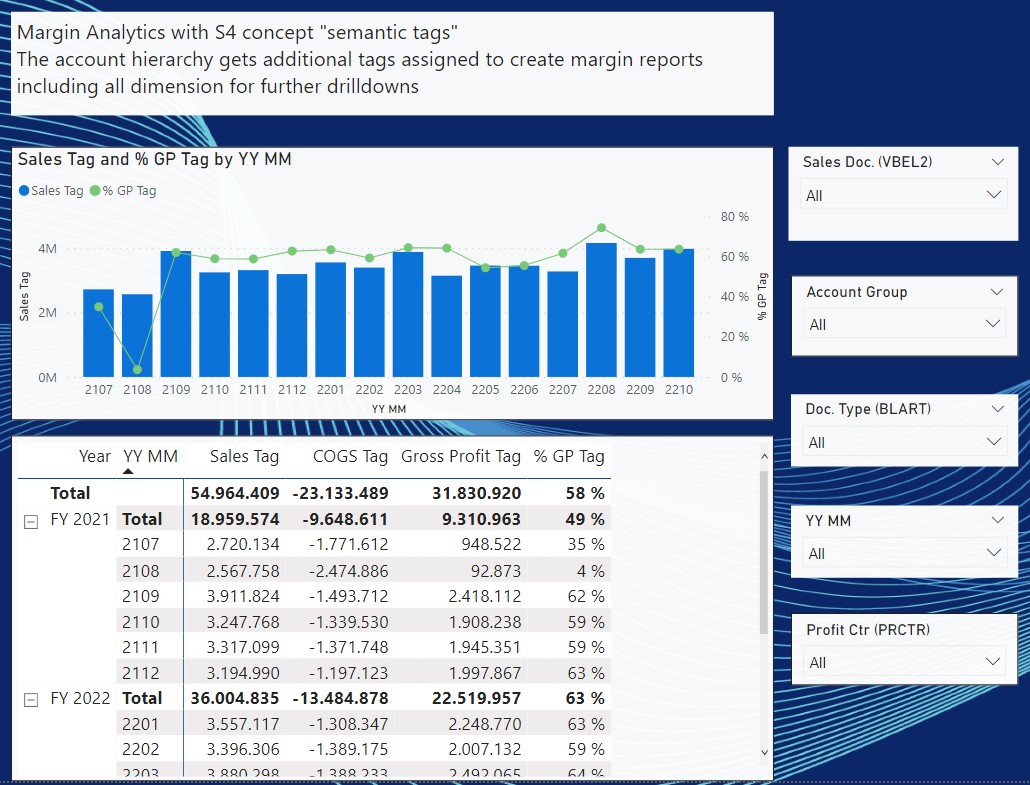
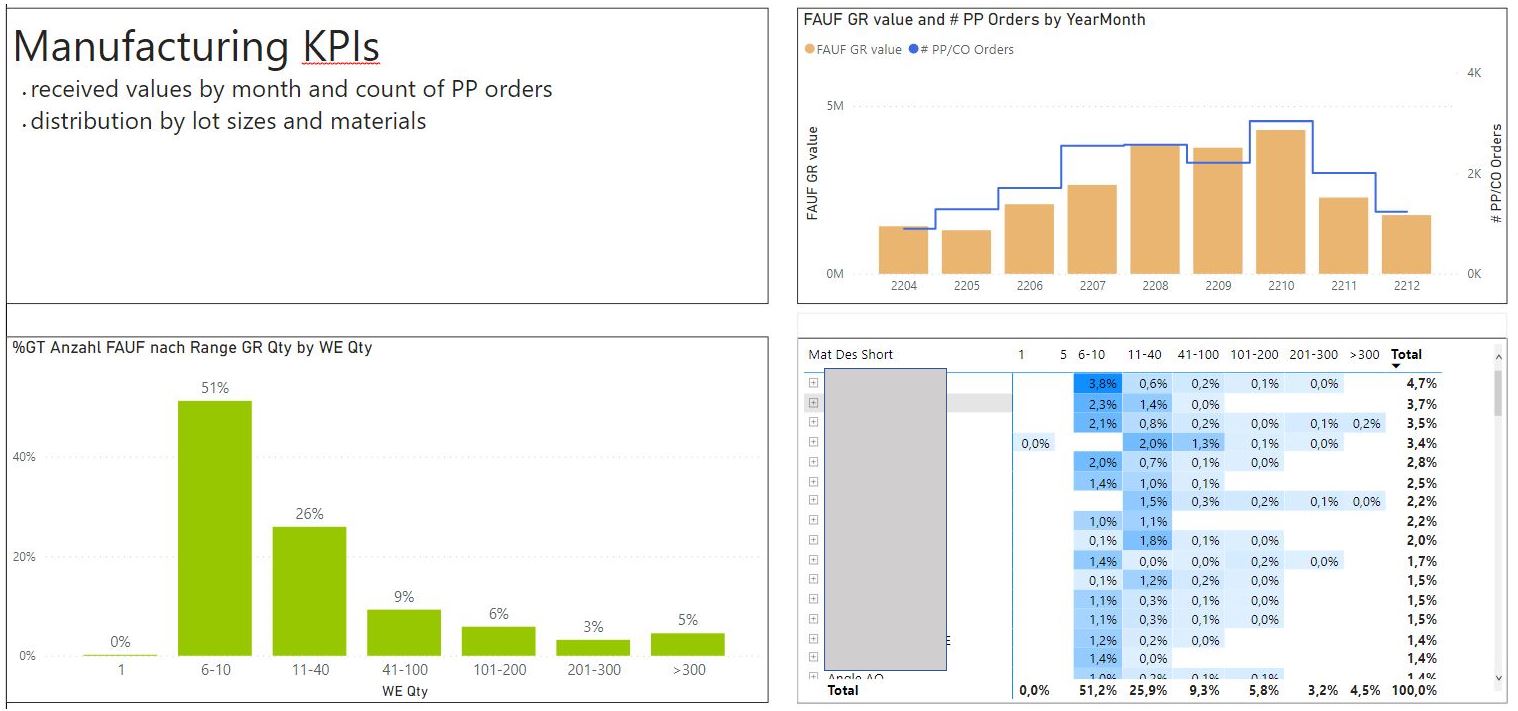
Step 3
Browse the reports:
 />
/>